The COVID❋GRAPH project has ended.
The COVID❋GRAPH project was an initiative that built a knowledge graph on COVID-19 from various public sources. It combined publications, case statistics, genes, molecular data, and many more entities in a Neo4j database.
Covid Graph Explorer

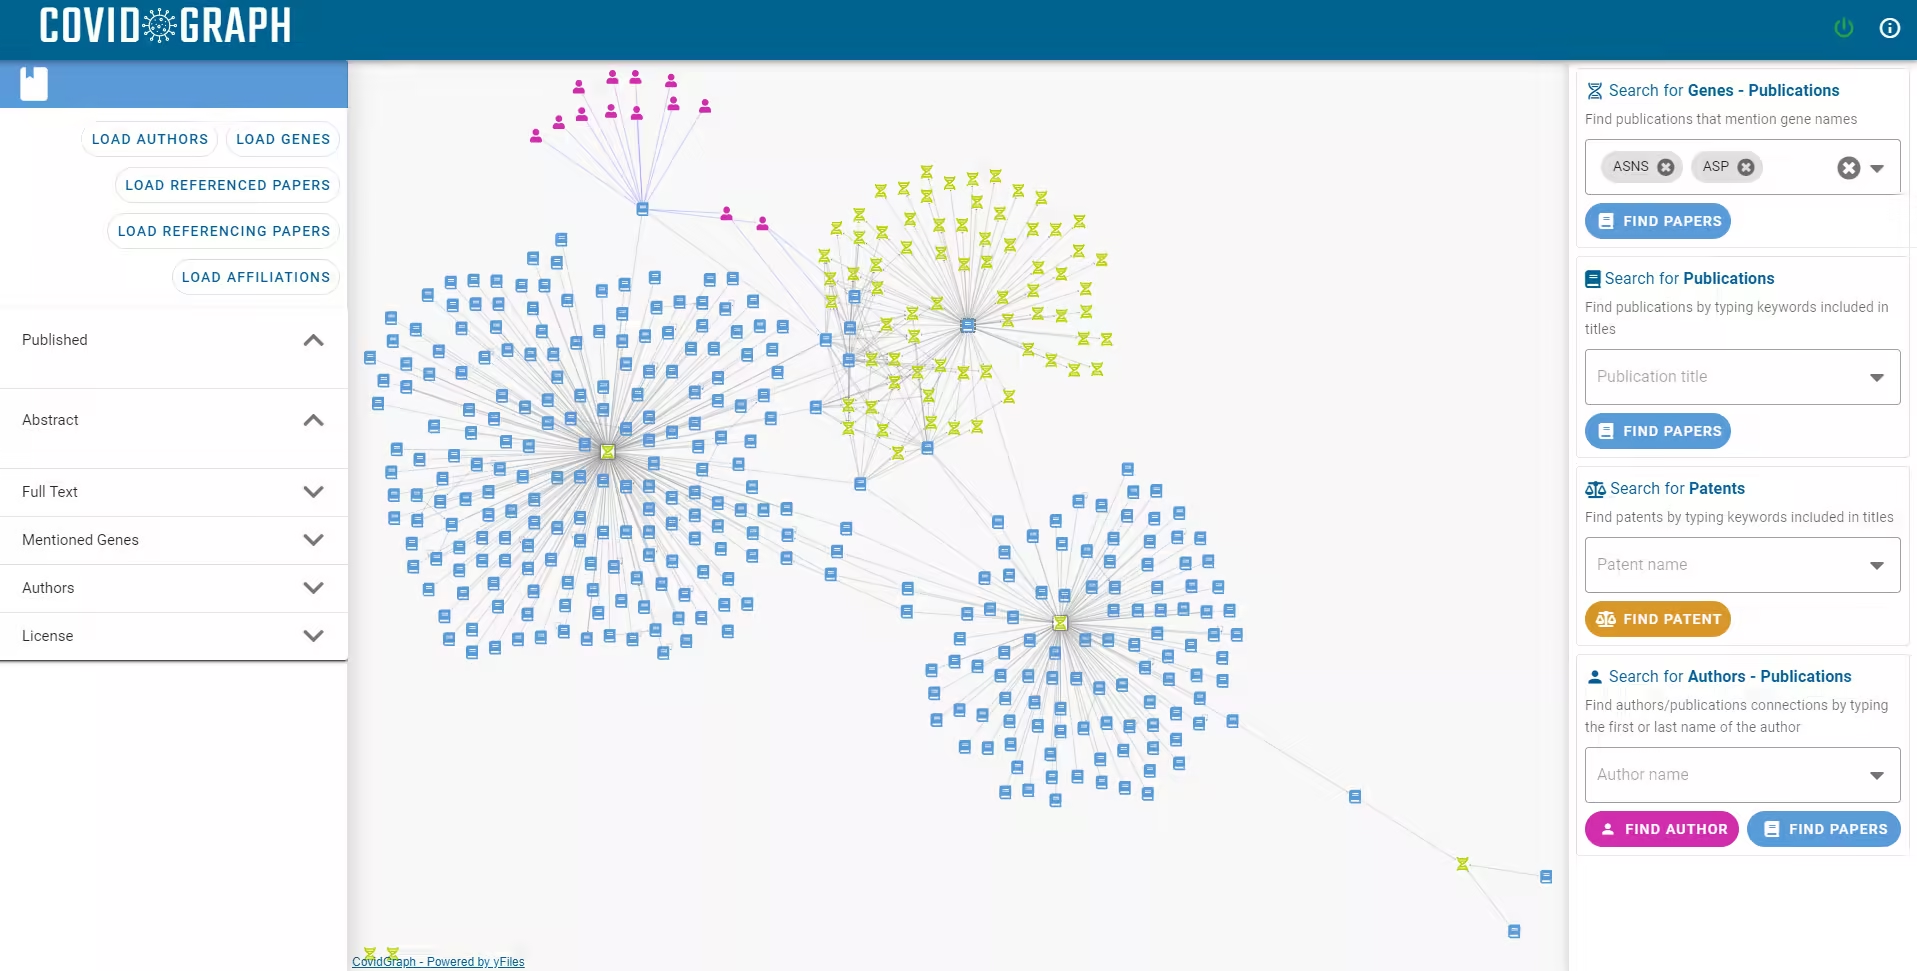
This application allowed users to interactively explore the database. Starting by searching for entities in the database, users could select an entity type and enter a query in the toolbar. If there were multiple matches for the query, users could preview and filter the results in a table and load them into a diagram. The visualizations were created with yFiles for HTML.
Discover more
To view more examples of how graphs can be used in various industries and applications, you can explore our collection of yFiles online demos or browse through some of the most common use cases!